
How to Read Mining Pool Statistics Across Coins
Pool statistics are only meaningful against a denominator. On 21 September 2026, BTC difficulty stood at 132.76 T with network hashrate near 1,003 EH/s, so a 1 PH/s machine inside a pool earns about 0.000449 BTC a day — $37.99 — and that figure moves whenever the network's total hashrate moves, regardless of what the pool's own chart shows. Reading statistics across several coins means reading two quantities per chain, never one.

Key takeaways
- Earnings depend on your pool's share of network hashrate, so a pool growing 10% while the network grows 30% leaves you about 15% worse off.
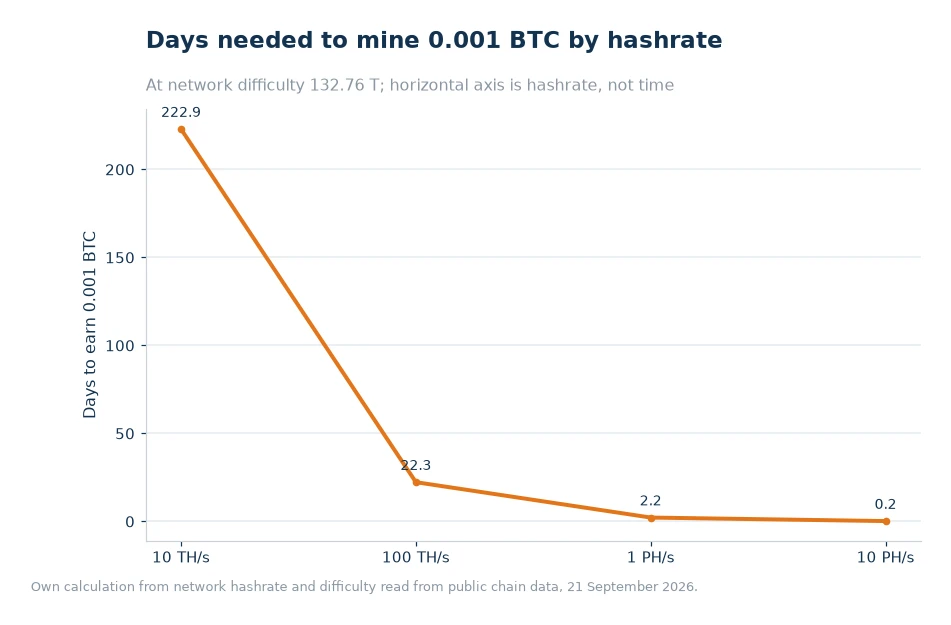
- At current difficulty, 0.001 BTC takes roughly 22.3 days at 100 TH/s, 2.2 days at 1 PH/s and 0.2 days at 10 PH/s.
- Reaching 0.001 BTC a day requires about 2,229 TH/s — a useful sanity check when a hashrate claim sounds impressive.
- Across coins, compare only per-chain output per TH/s; hashrate ratios between chains are not comparable because emission schedules differ.
Definitions first
Pool hashrate is the sum of machines currently submitting shares to that pool on that chain. Network hashrate is the total across the chain. Pool share is the first divided by the second, and it is the number that determines how often your pool finds blocks and therefore how much of the chain's emission it distributes. The pool's own hashrate chart is interesting only in relation to the network figure printed beside it.
Difficulty is the third input. It converts hashes into expected blocks: the higher it goes, the less each TH/s produces. Because difficulty retargets every 2,016 blocks and the next change was estimated at -2.12% on the read date, any comparison using last month's difficulty is already out of date.
| Statistic | What it measures | How to use it |
|---|---|---|
| Pool hashrate | Machines submitting to that pool on that chain | Divide by network hashrate to get the pool's share of blocks |
| Network hashrate | Total hashrate securing that chain | This is the denominator of your earnings formula |
| Difficulty | The retarget-adjusted work target | Sets output per TH/s at the current block subsidy |
| Active workers or miner count | Operator-side participant count | Shows whether growth is coming from more miners or bigger ones |
| Daily emission | New supply issued per day on that chain | Multiply by your share of network hashrate for gross output |
The trade-off nobody prices
Two pools can post identical hashrate growth and produce different outcomes, because the chains they serve are growing at different rates. Choosing a chain is therefore a bet on relative growth as much as on fees, and the fee itself is component-specific: a listed 4% on the PPS-settled block reward plus a listed 2% on transaction fees under PPS+, or a listed 2% across both components under PPLNS.[1] On a chain where transaction fees are a larger share of the block, that distinction is worth more than it is on Bitcoin.
Why cross-chain hashrate ratios mislead
A chain with a tenth of Bitcoin's hashrate is not ten times more profitable. Emission schedules, block intervals, subsidy curves and coin prices all differ, so the only comparable quantity is per-TH/s daily output in a currency you care about. Convert first, compare second.
Example with two setups
Both setups have 1 PH/s inside a pool. The pool's hashrate grows from 100 EH/s to 110 EH/s, a 10% increase. Setup A reads only that chart and concludes income is rising.
Setup B also reads the network figure, which has grown from about 1,003 EH/s to 1,304 EH/s — 30%. The pool's share of the network falls from 9.97% to 8.44%, so the same 1 PH/s now earns about 0.000380 BTC a day instead of 0.000449, or $32.14 rather than $37.99. The pool grew, the network grew faster, and the miner is 15% worse off while the dashboard shows a rising line.
Run the same reasoning forward instead of backward and the numbers become a planning tool. At current output, a miner holding 100 TH/s reaches 0.001 BTC in about 22.3 days; at 1 PH/s it takes 2.2 days; at 10 PH/s it takes 0.2 days. To earn 0.001 BTC every day, the required hashrate is about 2,229 TH/s — a figure worth remembering the next time a marketing claim implies otherwise.
Keeping that arithmetic current is easier when the two sides of the ratio sit on the same page. The pool hashrate view and the network difficulty figures published alongside it let an operator rebuild the formula in a minute, per chain, instead of trusting a growth chart that answers a different question.
Two further readings belong in the same routine. A miner ranking shows which hardware still clears its electricity cost at current price and difficulty, which is the practical test of whether a machine should stay pointed at a chain at all. And the published ViaBTC Mining Statistics maintain per-coin pool hashrate, network hashrate, difficulty and miner counts in one place, which is exactly the set of inputs the formula needs.
Practical next steps
- Pick one currency as your unit and convert every chain's output into it before comparing anything.
- Compute per-TH/s output per chain: chain emission divided by that chain's network hashrate, adjusted for your fee.
- Track pool share, not pool size. A growing pool in a faster-growing network is a shrinking position.
- Re-read difficulty after every retarget rather than reusing last month's figure.
- Sanity-check goals against hashrate, using thresholds like 2,229 TH/s for 0.001 BTC a day at current difficulty.
- Recheck monthly, because retargets and price moves reorder the comparison without any change on your side.
Frequently asked questions
Do mining pools cost anything to join?
Joining is free; the pool earns from its fee on settled payouts, which appears as a percentage of the block-reward and transaction-fee components.
Can I mine more than one coin at the same time?
Yes. Merged mining lets a machine secure a parent chain and an auxiliary chain together, and multi-coin pools support switching between chains without moving hardware.
Why can I not compare hashrate between two chains directly?
Because hashrate only has meaning relative to its own chain's network total and emission. Two chains with identical hashrate can pay completely different amounts per TH/s, so the comparison has to be converted to daily output in a common currency first.
What does a falling pool hashrate mean for me?
Less capacity searching for blocks, so blocks arrive less often on average — visible mainly as more variance in PPLNS payouts, where distributions follow blocks the pool finds. Under PPS+ the hourly credit depends on your accepted shares against current difficulty, so pool size affects block discovery rather than your per-share rate.
Read two numbers, not one
Before drawing a conclusion from any pool chart, find the network figure for the same chain and the same date, then compute the share. Convert per-TH/s output into a single currency, and keep the calculation next to your own hashrate so a change in either input is visible immediately. Statistics reward the reader who supplies the denominator — and penalise the one who does not.
Data and sources: ViaBTC mining statistics for per-coin pool and network hashrate, difficulty and miner counts[2], ViaBTC pricing page for the listed fee components[1] and the ViaBTC miner profitability ranking for hardware viability[3]. Network difficulty (132.76 T), network hashrate (about 1,003 EH/s), the 3.125 BTC block subsidy and the BTC price of $84,692 were read from public chain data and market feeds on 21 September 2026. The growth scenario above is illustrative arithmetic, not a record of past network behaviour.